
As mobile advertising quickly eclipsed television advertising, brands continue to search for the most effective means to activate and engage consumers.
Download this white paper
PREFACE
Since 2018, the meteoric rise of mobile marketing skyrocketed past TV as a generation of viewers cut their cords.
Coupled with the pandemic, online transactions are exponentially beyond the forecasts of 2018’s most optimistic projections.
Consumer behaviors have been permanently altered, leaving some brands giant winners and others, unable to hold on.
Complete understanding of these trends make a marketing plan infinitely more valuable when innovative, new tech is utilized.
Understanding the new tools in the global transmedia network of Sizzle functionalities will enable you to accelerate into this change with the benefit of all of the highly interconnected functionalities and systems.
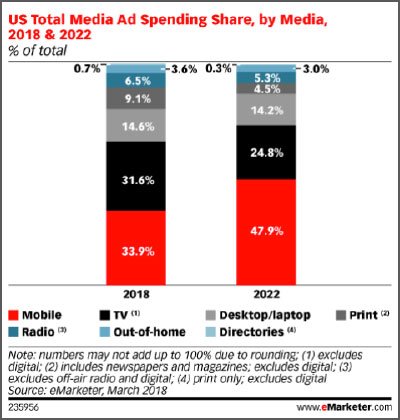
MOBILE VS. TV
KEY STATISTICS
- Mobile ad spending eclipsed TV ad spending in 2018
- The 2022 digital ad market is larger than the TV ad market by $85 billion
- 18-24 year olds watch 10 less hours of TV/week in the last ten years
- 68% of Americans prefer online video to live TV
- 1 in 10 18-34 year olds, will never subscribe to any TV service
- By 2025, 50% of viewers 32 and younger will not be subscribed to any TV service
- Millenials watch 50% of the amount of TV than adults 35+

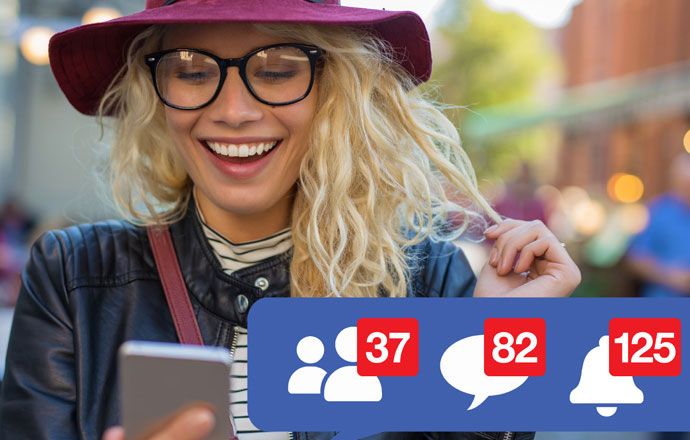
WINNING CONSUMERS

- Social media advertising budgets have doubled worldwide
- 77% of consumers want to be acknowledged. If they Tweet, they want a response in 4 or less hours
- Average spend for small businesses on Google Ads is $9-10,000/mo.
- 76% of marketers fail to use behaviorial data for online ad targeting
- People are served 1700 banner ads per month but see less than half of them
- 84% of people expect brands to create content
- 88% of B2B marketers agree that creating content makes their audience view the organization as a credible and trusted resource.
CONSUMERS WANT TO BE COMMUNICATED WITH, NOT MARKETED TO.
TRADITIONAL PULL APPROACHES
Online advertising continues to evolve, but clear trends are predictable.
01
Google and Facebook
(eMarketer)
These two dominate that largest share of total U.S. digital ad spending, with 37.2% and 19.6% respectively
While Amazon works to take an ever larger percentage of the online advertising space, Google and Facebook reamin the two most dominant sources in the market.
02
Ignored sponsored search results
(Search Engine Land)
70% – 80% of users ignore sponsored search results, further increasing the value of ranking organically instead of paying Google to advance your page to the top of the search results.
Consumers are also less inclined to trust the advertised brands in the search results.
03
Viral sharing of videos
(Forbes)
Videos are shared 1200% more than text or links combined.
Well-crafted, compelling video content is among
the most powerful online advertising tools.
People remember videos
for longer and share
them more frequently
than they do other
media.
UP UNTIL NOW, WHAT WAS MOBILE ADVERTISING?
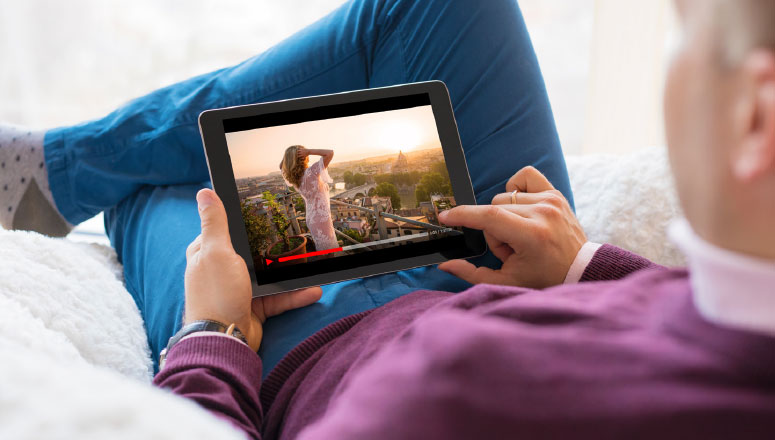
Mobile advertising finally surpassed TV advertising in 2018. Let’s explore the consumer preferences and trends that have lead to this eventuality.
THE NEW PARADIGM IN CONSUMER RELATIONSHIPS
INNOVATIONS
KEEPING A CUSTOMER ENGAGED ALL THE WAY THROUGH
THE CHECKOUT PROCESS
More than 72% of all online shopping carts are abandoned
(Marketing Sherpa)
Customers are hasty to abandon their online shopping carts. This has proven to be a substantial issue for onliness businesses, since only 8% of users return to finish theirshopping, once they had initially abandoned the cart.
BRANDED CONTENT
(HAVAS)
84% of consumers expect brands to create content. Brand engagement is extremely important to consumers. Storytelling, useful solutions and entertaining experiences.
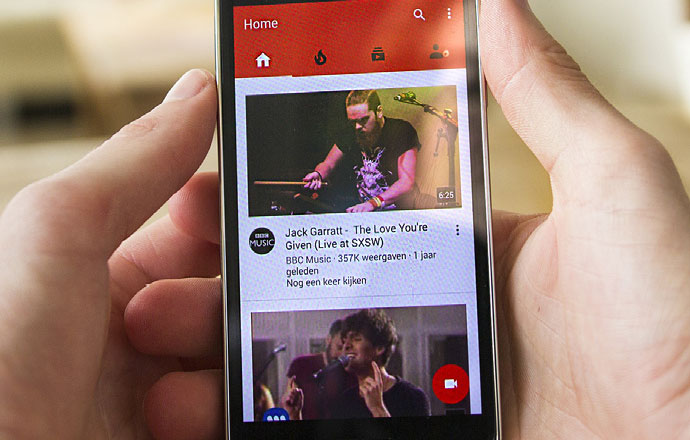
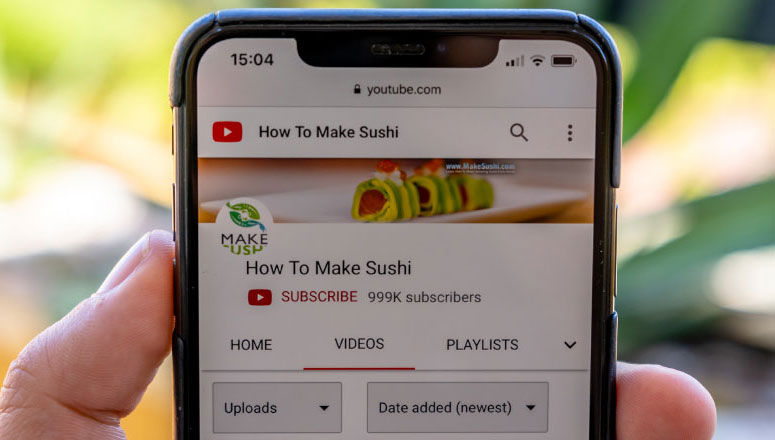
YOUTUBE
(IPSOS)
YouTube mobile ads receive viewer attention 83% of the time, whereas TV ads only get attention 45% of the time. TV ads simply last too long.
(FACEBOOK, INC.)
Facebook has 80 million pages for small and medium-sized businesses, representing a 23% year-on-year increase. The number of businesses that advertise on the platform has now exceeded 6 million.
(TWITTER)
77% of Twitter users appreciate a brand more when it responds to their Tweet. Customers expect a fast response to their Tweet, usually only happy if the response is under 4 hours as opposed to the traditional 10 hours that is currently the norm.
Interactive media is the future of consumer activation, engagement and transactions. Brands who are most able to adapt to these methodologies will excel most quickly during this decade.
CUSTOMER SERVICE
AN OPEN ENTRY POINT
PROVIDING IMPE CCABLE CUST OMER SER VICE IS CRITICAL TO MAINT AING A HIGH OPINION OF YOUR BRAND IN THE MINDS OF YOUR C ONSUMERS.
(The State of Social Customer
Service)
71% of consumers who are happy with the customer service they get via social media are likely to recommend that brand to others.
Social media can be a great tool for increasing brand engagement and attracting new customers. One of the best ways to achieve this is to offer outstanding customer service via your social platforms.
A good reputation among users and their word-of-mouth recommendations will help you lower your internet advertising costs, allowing you to invest the money you save into other things.
(Smart Insights)
While 80% of businesses that have an online presence believe they deliver great customer service via their social media channels, only 8% of their customers agree.
As far as advertising stats go, this is a real punch in the guts. It can be easy to think you’re doing a good job from inside your office, but it’s your customers’ opinions that really matter.
Don’t overestimate the quality of your customer service, and most importantly, don’t ignore what your customers are telling you. If you strive to be better, you’ll benefit from your users’ word-of-mouth recommendations.
IMPACT OF YOUTUBE

YOUTUBE ADVERTISING STATISTICS
(Think With Google)
While people are spending much less time in front of a TV, they’re watching more YouTube than ever before.
As the second-most-visited site on the internet and the main platform for Google video ads, YouTube has seen incredible growth. More and more people spend increasing amounts of time watching content on the site. In 2015 alone, 18- to 49-year-olds spent 4% less time watching TV and 74% more time watching content on YouTube.
LEARN BEFORE YOU PURCHASE
80% of shoppers who watch a YouTube video related to a purchase they’re planning to make do so at the start of the process.
YouTube has proven to be a remarkably important web advertising tool for consumers who seek to better inform themselves before choosing a product to spend their money on. With almost 2 billion monthly users and a huge number of content creators, there is always an expert opinion to be found on any product or service worth buying.
PULL METHODS WORK
VIDEO PROGRAMMING AND COMMERCIALS MAY BE PROGRAMMED INTERACTIVELY

70% screenings are on mobile
(eMarketer)
Mobile phones are a major entry point for internet access in many markets across the world, and have also become the most popular devices for watching video content. Almost a quarter of the world’s population will watch a video on a phone this year.

Business advertising
(Youtube)
Since 2016, twice as many small and medium-sized businesses are advertising on YouTube. Given that YouTube’s robust advertising tools can successfully analyze your target audience and reach the most valuable potential customers, it’s no surprise that the number of small and medium businesses creating online ads for YouTube is rising steadily.
Product review videos
(Youtube)
In the digital age, customers are increasingly using video content to inform themselves before making purchases. This trend of researching other people’s opinions and experiences gives good products exposure and helps increase revenues.
TV ADVERTISING STATISTICS
ACTIVATIONS

INVESTING IN TV WILL MOST LIKELY INCREASE ADVERTISING
EFFECTIVENESS BY 40%
(Thinkbox)
Whether in the short or long term, TV still delivers great bang for your advertising buck. It’s one of the lowest-risk methods of investing in advertisement, with a high likelihood of profit return. That likelihood is 70% between three and six months, and 86% over three years.
ADVERTISING SPENDING
EXPERTS PREDICT THAT TV ADVERTISING SPENDING WILL
GROW STEADILY TO $75 BILLION IN 2022
(MarketingCharts)
TV remains the best form of advertising for cashed-up marketers who are willing to spend large amounts on ad campaigns for mass audiences. However, as audiences shift to digital media and advertisers pursue more multichannel campaigns, it’s getting tougher to make TV work for your business. Brands need to create TV ads that catch viewers’ attention and keep them engaged.
Teens and millennials watch 40% less traditional TV than they did five years ago.
The amount of time 18- to 34-yearolds as a whole spent watching
traditional TV – both live and timeshifted – in Q3 2018 dropped by about 17.2% from the previous year.
Younger people are watching less and less television, which is bound to have a negative impact on TV advertising effectiveness.
LICENSE TO PROMOTE

THE AVERAGE ADULT SPENDS 5 HOURS AND 24 MINUTES PER DAY WATCHING VIDEOS
(MarketingCharts)
Television remains one of the best media for marketers to use product placement and other subtle advertising strategies. When you consider that people watch nearly 5.5 hours of video per day, TV’s effectiveness makes sense. Surprisingly, though, this figure is actually three minutes lower than the previous year. This includes traditional TV, TV-connected devices, and video on computers, smartphones, and tablets.
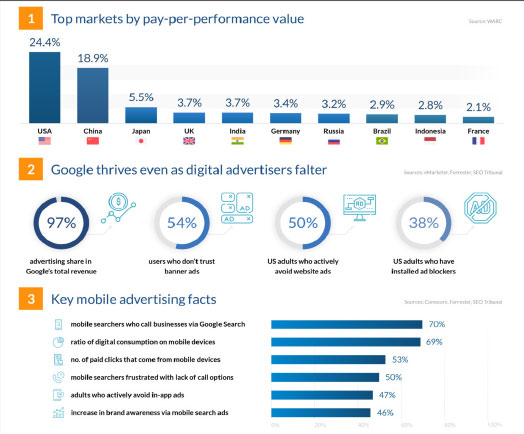
MOBILE ADVERTISING STATISTICS
INNOVATIONS
MOBILE SEARCHES FOR BEST HAVE GROWN 80% IN THE PAST TWO YEARS
TRENDING UPWARDS
(Think with Google)
This is one of those digital advertising trends that shows how much consumers value search engines as a tool for helping them make smart purchases. People are turning to their phones for advice, however large of small their decision may be.
(Connext Digital)
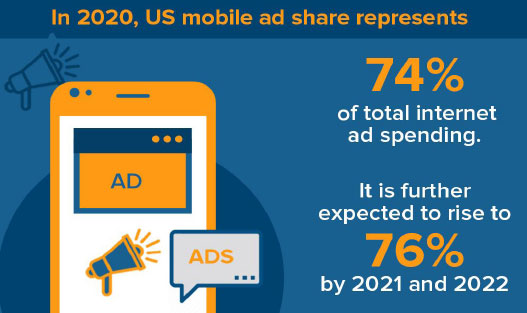
This information reflects the growing dominance of mobile devices compared to desktop computers, with up to 70% of total web traffic and 72% of digital ad spend now taking place on mobile. In-app advertising will rise to a staggering $201 billion over the same timeframe.
68% of companies have integrated mobile marketing into their overall marketing strategy.
(Salesforce)
Targeted advertising facts show just how profitable mobile marketing has
proven to be as part of a cohesive brand strategy. Now, 71% of marketers believe mobile marketing must be at the core of their business development plans.
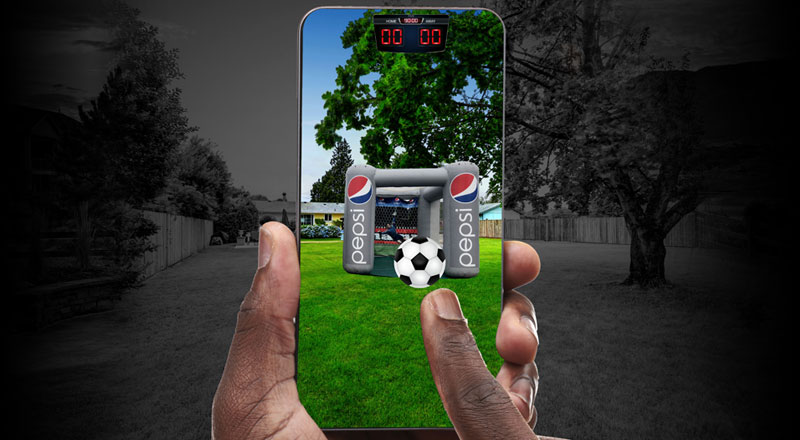
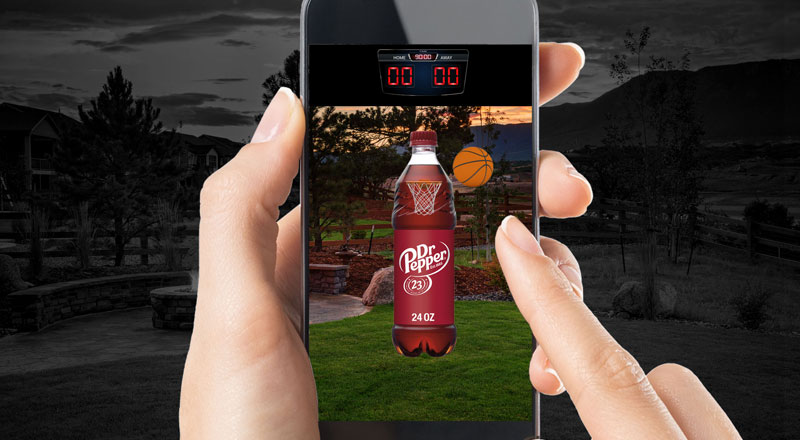
SIZZLE BRANDED SPORTS GAMES ACTIVATE AND ENGAGE
TAKING THE BITE
2/3 OF U.S. DIGITAL ADVERTISING IS DEDICATED TO MOBILE

(Hollywood Reporter)
Amazon is emerging as the new ad powerhouse in this digital world, and the company’s focus on mobile devices is no coincidence. Advertisers on Amazon have unprecedented access to consumer behavior data and targeted advertising statistics, and are given access to purchase data in real time.
In the span of just one year, from 2018 to 2019, the total number of devices around the world with ad blockers rose from 142 million to upwards of 615 million.
(PowerTraffick)
Consumers don’t necessarily hate all advertisements, as 83% of them wish that they could just filter those they don’t want to see instead of blocking them all. The problem lies in intrusive, bad ads that ruin user experience, which is why a smart approach to designing and implementing ads is becoming increasingly important.
Worldwide digital ad spending is predicted to reach over $375 billion by 2021.
(eMarketer)
The total amount of money spent on digital ads has been rising over the years, even though the rate of increase has fallen slightly. Experts predict that over the next two years, this spending will increase by a staggering $75 billion.
Download this white paper
sales@sizzlesells.com
Sizzle’s representatives will be happy to assist you.